Binocular Vision Project

Here is a figure extracted from a research article I published in the Journal of Vision.
This was a project with a fairly small data set, and very simple bar graphs are used. The challenge here was to summarize the results for observers with normal binocular vision (called stereonormals) as well as a diverse group of subjects with abnormal binocular vision. The solution was to plot each data point and the group means together. Each gray dot represents the score for one observer, and the blue bars plot the mean for each group. In some cases, the gray dots are shifted horizontally so that they don't occlude each other. Interesting aspects of the data are thus made visible. For example, in panel A, the test is too easy for normal subjects (large scores are good), and the discrete nature of the scores can be seen. In panel B, the test is too hard for the anomalous subjects (large scores are bad), and the scores are more continuous on the y-axis.
Cooper PR, Mendola JD. Abnormal sensory eye dominance in stereoanomalous subjects. J Vis. 2019 Nov 1;19(13):14. doi: 10.1167/19.13.14. PMID: 31747692..

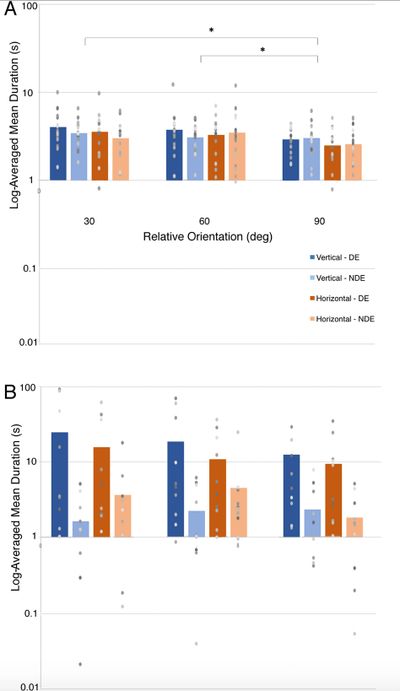
A second figure from the same article in the Journal of Vision.
This figure shows the results of additional behavioural vision testing in the same groups of subjects discussed above. In this case, the scores for the normal subjects (in panel A) were so much smaller than for the anomalous subjects (in panel B) that a log scale was used on the y axis. Shades of blue and orange were used to code 4 experimental conditions (2 categories x 2 levels).
All my research articles can be viewed on the PubMed database.
Copyright © 2021 Nuance Concepts - All Rights Reserved.
Powered by GoDaddy